Command-line interface
Many things I do with tomso lend themselves to being done from the
command line, so tomso provides an executable script tomso, which
should be in your $PATH after installing tomso. If it isn’t,
let me know (e.g. by opening an issue on GitHub)! The script has
three subcommands: info, convert and plot. The script
uses argparse, so you can get help for the script itself with
tomso -h or for any of the subcommands with tomso subcommand
-h.
Unless given a format with the relevant argument, all the subcommands will try to guess the format of a file from the filename. If the guess fails, pass the format explicitly.
tomso info
The info subcommand shows some basic information about the file that you
pass by calling print on the object (and therefore invoking
its __str__ function). For example, tomso info ../tests/data/modelS.fgong
shows some basic information about the Model S stellar model. The format
is detected from the .fgong suffix.
For MESA and GYRE files, the info subcommand shows what columns are
available. e.g., tomso info ../tests/data/gyre.mode_3 -F mode produces
where we explicitly provide the mode format because the
.mode_3 extension obscures the fact that it’s a mode file.
Note also that the GYRE file actually has column names like
Re(xi_r) but the brackets are scrubbed by NumPy’s genfromtxt
function, which is how the files are read.
tomso convert
The convert subcommand converts stellar models for oscillation
programs from one format to another. The currently supported formats
are FGONG, ADIPLS binary models (AMDL), and GYRE models. For example,
we could convert Model S from the distributed FGONG format to an
ADIPLS-ready AMDL file using
tomso convert ../tests/data/modelS.fgong -o modelS.amdl -G 6.67232e-8
where the formats are inferred from the .fgong and .amdl
extensions. Formats for the input and output files can be passed
explicitly with the -f/--from and -t/--to flags, respectively.
The value of the gravitational constant G is passed explicitly because Model S is in an older FGONG standard that doesn’t include it in the file itself.
tomso plot
The plot subcommand facilitates quick look plots to inspect data
in many of the formats that tomso supports. Let’s plot a MESA track in the
Hertzsprung–Russell diagram:
tomso plot ../tests/data/mesa.history -x Teff -y log_L --prune --flip-x
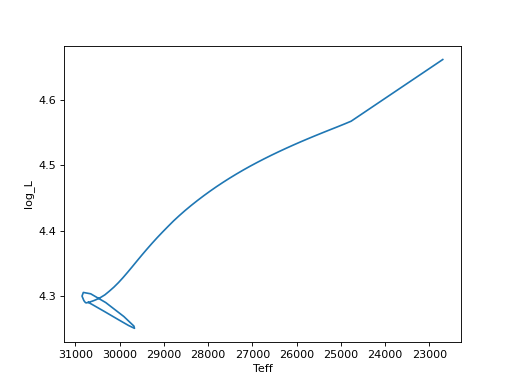
Note that Teff isn’t in the history file but log_Teff is and
the MESALog object tries to plot 10**log_X if it can’t find
X in the data. Similarly, you could plot log_Teff even if
only Teff were in the data.
We can construct a similar plot for the STARS data, though it’s less interesting.
plot ../tests/data/stars.plot -F stars-plot -x logTeff -y logL --flip-x
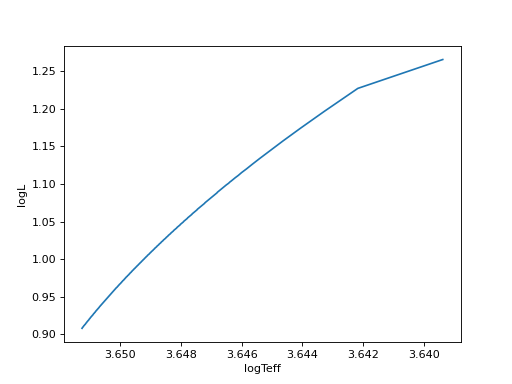
The STARS data formats don’t yet support transforming between logarithmic and linear variables, as above.
Command line help
For completeness, here’s a reproduction of the command-line help given
by typing tomso <subcommand> -h.
usage: tomso [-h] command ...
Positional Arguments
- command
Possible choices: info, convert, plot
Sub-commands
info
Show basic information about tomso-compatible files. Really just calls print on the object after loading it.
tomso info [-h]
           [-F {history,mode,gsm,agsm,gyre,stars-plot,profile,summary,stars-summ,fgong,amdl,guess}]
           [-G G]
           filenames [filenames ...]
Positional Arguments
- filenames
Named Arguments
- -F, --format
Possible choices: history, mode, gsm, agsm, gyre, stars-plot, profile, summary, stars-summ, fgong, amdl, guess
Default:
'guess'- -G
gravitational constant that, if given, will override the inferred value from a stellar model
convert
Convert a stellar model from one format to another.
tomso convert [-h] [-f {fgong,gsm,amdl,gyre,guess}]
              [-t {fgong,gsm,amdl,gyre,guess}] -o OUTPUT_FILE [-G G]
              [--ivers IVERS]
              input_file
Positional Arguments
- input_file
Named Arguments
- -f, --from
Possible choices: fgong, gsm, amdl, gyre, guess
Default:
'guess'- -t, --to
Possible choices: fgong, gsm, amdl, gyre, guess
Default:
'guess'- -o, --output-file
- -G
gravitational constant that, if given, will override the inferred value from the model
- --ivers
value of ivers for output FGONG files (default=1300)
Default:
1300
plot
Create quick-look plots from tomso-compatible files. Many plotting options are passed to the relevant matplotlib function (e.g. axvline, xlabel). Where multiple arguments are given (e.g. for y values), the script tries to loop over them sensibly but if you’re trying to make something complicated, you’re probably better off using tomso’s modules in your own script.
tomso plot [-h]
           [-F {history,mode,gsm,gyre,stars-plot,profile,summary,stars-summ,fgong,amdl,guess}]
           [-x X] [-y Y [Y ...]] [--xlabel XLABEL [XLABEL ...]]
           [--ylabel YLABEL [YLABEL ...]] [--prune]
           [--legend LEGEND [LEGEND ...]] [-s STYLE] [--scale-x SCALE_X]
           [--scale-y SCALE_Y] [-a AXIS AXIS AXIS AXIS] [--flip-x] [--flip-y]
           [--axvline AXVLINE [AXVLINE ...]] [--axhline AXHLINE [AXHLINE ...]]
           [--plotter {plot,semilogx,semilogy,loglog}]
           [--title TITLE [TITLE ...]] [-S STYLE_FILE] [-G G]
           filenames [filenames ...]
Positional Arguments
- filenames
Named Arguments
- -F, --format
Possible choices: history, mode, gsm, gyre, stars-plot, profile, summary, stars-summ, fgong, amdl, guess
Default:
'guess'- -x
- -y
Default:
['']- --xlabel
- --ylabel
Overrides the axis label with the given string. Accepts spaces. i.e. ‘effective temperature’ is OK. Default is to use the first argument of -x/-y.
- --prune
Make the model number monotonic by only using the last model of with any given model number and restrict models to those with model number less than that of the last model. Useful for removing apparent reversals in time or model number because of backups and retries, and for models that finished with fewer models following a restart.
Default:
False- --legend
If ‘auto’, add a legend using the filenames as keys. If ‘unique’, shorten filenames by removing common characters from the beginnings and ends. Otherwise, use the arguments as a list of keys (default is no legend).
- -s, --style
point style, passed to plot function (default=’-‘)
Default:
'-'- --scale-x
multiply variables on x-axis by this much (default=1)
Default:
1.0- --scale-y
multiply variables on y-axis by this much (default=1)
Default:
1.0- -a, --axis
- --flip-x
reverse the x-axis
Default:
False- --flip-y
reverse the y-axis
Default:
False- --axvline
plot a vertical line at this value (can be header key)
Default:
[]- --axhline
plot a vertical line at this value (can be header key)
Default:
[]- --plotter
Possible choices: plot, semilogx, semilogy, loglog
use ‘matplotlib.pyplot.plotter’ to plot (default=’plot’)
Default:
'plot'- --title
Adds the given title to the plot. Accepts spaces. i.e. ‘my plot’ is OK. Default is no title.
Default:
['']- -S, --style-file
Specifies a matplotlib style file to load.
- -G
gravitational constant that, if given, will override the inferred value from a stellar model