tomso: Tools for Models of Stars and their Oscillations

tomso is a set of Python modules for loading and saving input and
output files for and from stellar evolution and oscillation codes.
The functions are bundled together in modules that correspond to a
specific stellar evolution code, stellar oscillation code or file
format. tomso currently supports the
FGONG
format and various input/output files for
ADIPLS,
GYRE,
MESA and
STARS.
The code is intended to be the minimum necessary to usefully manipulate input and output data. The only current requirement is NumPy. Matplotlib is optional and only required for the command-line plotter.
Installation
You can install most recent stable(ish) version of tomso from the
Python Package Index using:
pip3 install tomso
perhaps with the --user flag, depending how you administer your
system and with -U or --upgrade to upgrade from a previous
version.
The development version is on GitHub. The repo also includes unit tests and test data, which I try to omit from the PyPI package to keep it small. The tests are written using unittest and must be run from the tests directory. I usually run the tests using pytest with:
cd tests
pytest
but you can run them as standalone Python scripts with, e.g.:
ls test_*.py | xargs -n1 python3
The tests retrieve some online data to check that we can read from URLs. These will fail if you’re offline or run slowly if your internet connection is slow.
Basic usage
tomso provides a straightforward interface for multiple tasks on
stellar models.
For a simple real-world example, to convert an FGONG file (that doesn’t have G in the header) to an ADIPLS binary stellar model file, use:
from tomso import fgong
m = fgong.load_fgong('model.fgong', G=6.67430e-8)
a = m.to_amdl()
a.to_file('model.amdl')
You can also use the command-line interface::
tomso convert model.fgong -o model.amdl -G 6.67430e-8
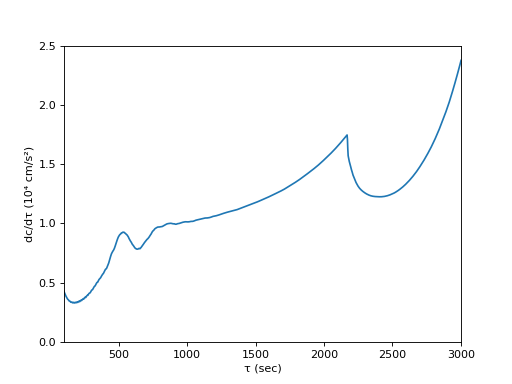
The object-oriented interface makes plotting easier. Here’s Fig. (7.30) of Aerts, Christensen-Dalsgaard & Kurtz (2010):
import numpy as np
import matplotlib.pyplot as pl
from tomso import fgong

S = fgong.load_fgong('https://users-phys.au.dk/jcd/solar_models/fgong.l5bi.d.15c', G=6.67232e-8)
pl.plot(S.tau, np.gradient(S.cs, S.tau)/1e4)
pl.xlabel("τ (sec)")
pl.ylabel("dc/dτ (10⁴ cm/s²)")
pl.axis([100., 3000., 0., 2.5])
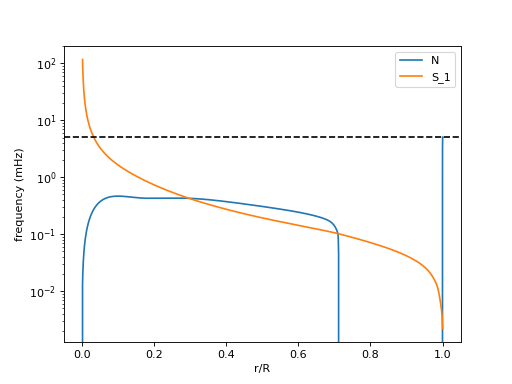
The command-line interface also allows you to make some quick look plots, like a propagation diagram for Model S:
tomso plot "https://users-phys.au.dk/jcd/solar_models/fgong.l5bi.d.15c" -G 6.67232e-8 -x x -y N S_1 --legend auto --scale-y 0.1591549e3 --plotter semilogy --axhline 5.2 --xlabel "r/R" --ylabel "frequency (mHz)"
where the --scale-factor multiplies the angular frequencies by
1000/2π.
The code is described in more detail through the links in the user guide. The module APIs list all available functions.
Contributing
Something isn’t working
Search the issues on GitHub and, if your problem hasn’t been addressed before, open a new issue that describes what you tried to do, what you expected to happen and what happened instead. In case it’s helpful, include your operating system, Python version and NumPy version. Also try to include a minimal working example, including the files (or parts thereof) that are causing the problem.
I found a bug and wrote a patch to fix it
If you’ve found the problem is something in tomso that doesn’t work as it
should and fixed it yourself, great! Open a
pull request
that describes what the problem was and how your patch fixes it.
I want tomso to support my favourite file format
Open an issue with links to the specification of the file format or
where I can find (or create) examples with which to test new code. I
have limited time to extend tomso’s features unless it happens to
align with research I’m doing but I’ll try my best to implement
something.
Thanks
Earl Bellinger, who showed me how to read Fortran binary files in Python, without which most of the ADIPLS module would be impossible.
Vincent Böning, who extended
adipls.load_amdeto read output withinomde=2or3.